Introducing Multielectrode Data#
This lesson was written by Aaron J. Newman, based on Chapter 4 of Nylen, E.L., and Wallisch, P.. (2017). Neural Data Science. Academic Press.
About the data#
The data used here are from a study published by Snyder, Morais, Willis, and Smith (2015). The goal of the study was to relate neural activity across different scales, from single unit (single neuron) to whole-brain networks. To do this, the researchers simultaneously recorded neural activity from a 96-electrode array implanted in the brain, and EEG electrodes on the scalp, of rhesus macaque monkeys. Here we will work with only the 96 electrode invasive recordings, and not the EEG. Of interest is spike count correlation, which is a measure of neural functional connectivity. Functional connectivity is of widespread interest in neuroscience, and essentially refers to correlations in activity between different brain areas. If different brain areas (or individual neurons) show correlated activity, it is likely that they work together in some way. This is particularly true if their functional connectivity changes as a result of experimental manipulations. For example, if two areas (or neurons) show stronger correlation during a particular task than during a control condition, then we might infer that their functional connectivity is related to their involvement in the experimental task. Indeed, in their introduction Snyder and colleagues note that spike count correlations are structured and modulated by both perceptual and cognitive manipulations.
Recording#
The data were recorded from a Utah intracortical multielectrode electrode array (Maynard, Nordhausen, & Normann, 1997) implanted in area V4 of the visual cortex. The Utah array is shown in the figure below:

This is a type of microelectrode array consisting of a 10 x 10 grid of silicon microelectrodes that can be placed directly on the cortical surface of a living animal, covering an area of approximately 16 mm2. Each electrode is ~1 mm long, and the tip of each electrode records electrical voltage. In general, the electrodes do not penetrate individual neurons (and if they do, they likely destroy those cells), and so each electrode records signals from a small population of surrounding neurons. The strength of the electrical signals measured by the electrodes drops off with the inverse of the distance from it (i.e., 1/distance). This has two important implications:
Each electrode is spaced far enough apart that it will generate a unique measurement from other electrodes, because the signal strength drops off rapidly with distance.
However, because the electrodes are still relatively close together, and neurons will be located between electrodes, the spiking activity of any single neuron will typically be detected by more than one electrode.
Because we are interested in the behavior of neurons, not in anything inherent about the electrodes used for measurement, it is common practice to apply spike sorting to multiunit data. This is a mathematical process that takes microelectrode array data as input, and returns as output the spike times for individual neurons. Spike sorting is applied to the data after recording, to create separate spike trains for each neuron.
Spike sorting is a form of inverse problem, meaning that there are many possible solutions, and so the results of spike sorting are dependent on the algorithm used, and may not be entirely accurate. Nonetheless, spike sorting algorithms at this point are well-established and reasonably trustworthy. In the present data, spike sorting has already been performed, so the data are treated as coming from individual neurons.
Stimuli#
The data here were collected in an experiment in which the monkeys viewed drifting sine wave gratings. As shown below, sine wave gratings are images that plot a sine wave in 2 dimensions. As you likely know, a (1D) sine (or cosine) wave is a regularly oscillating waveform, like this:
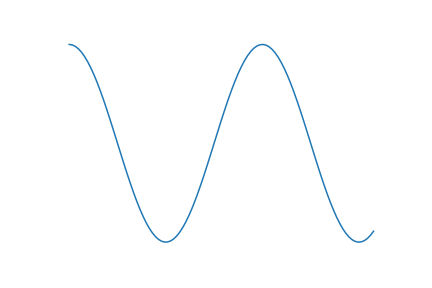
A sine wave grating is the 2D version of this. You can imagine that you’re looking down on the top of the wave shown above, such that the peaks are white and the valleys are black:
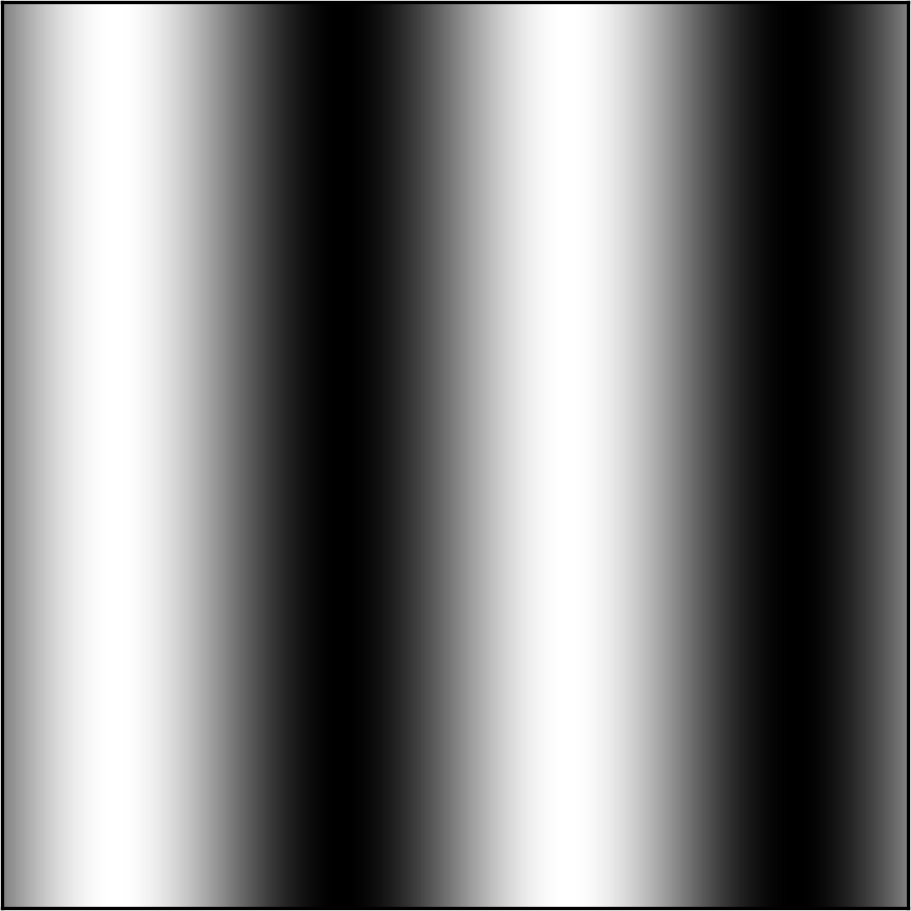
Sine wave gratings are commonly used in visual neuroscience because of their ability to drive neural activity. Recall that many cells in the visual cortex respond to edges, or contrast. Sine wave gratings have high contrast that drives these cells nicely. Drifting sine wave gratings, as used in this experiment, are animated versions in which the grating appears to move, such that a given region of the visual field (the receptive field of the neuron) is stimulated by smoothly-varying intensities from black to white.
Experimental design#
The data here comprise 2300 trials recorded from area V4 of the visual cortex of one monkey. Each trial was 2150 ms in duration, and began with a 150 ms fixation period (when the monkey was trained to fixate on a dot at the centre of a screen), followed by a 2000 ms presentation of the drifting sine wave grating.
There were two experimental conditions, one in which the orientation of the grating was 0 deg (horizontal bars) and one at 90 deg (vertical bars). There were an equal number of trials (1150) in each of the two conditions.
Research question#
The first, and most simple, question is whether any neurons respond to the stimuli and if so, if any of the neurons are sensitive to the orientation of the grating. We strongly expect that the answers to these questions are “yes”, based on prior literature and the fact that we are recording the responses of neurons in the visual cortex, to visual stimuli. But from the point of view of learning to work with the data, these are essential first questions and indeed, in any scientific experiment you should first confirm that the expected — if basic — results are present. This is commonly called a sanity check. It’s important because if your data don’t show expected, basic results that replicate prior work, then you shouldn’t trust those data to yield new and meaningful findings.
The central research question we will address at the end of this lesson is whether there is evidence of functional connectivity within the population of V4 neurons recorded. Functional connectivity essentially refers to correlated activity between neurons; such activity suggests that the neurons are working together as part of a network. Specifically, the research questions of this study are:
Does stimulation with a sine wave grating increase functional connectivity between neurons?
If so, are increases in functional connectivity specific to the orientation of the stimulus?
Hypothesis: Since we know that individual visual cortex cells are tuned to specific orientations — meaning that they fire more in response to their “preferred” orientation than other orientations — we would expect that some cells will show stronger firing in response to 0 deg sine wave gratings, and others will show stronger firing to 90 deg gratings. Thus we expect that functional connectivity will increase during visual stimulation, as all of the neurons tuned to that orientation fire and thus show stronger correlations in spiking relative to when they are not firing. Because of the orientation tuning of neurons, we expect the second research question to be true as well: the increases in functional connectivity will be orientation-specific.
References#
Maynard, E.M., Nordhausen, C.T., and Normann, R.A.. (1997). The Utah Intracortical Electrode Array: A recording structure for potential brain-computer interfaces. Electroencephalography and Clinical Neurophysiology, 102(3), 228-39. https://doi.org/10.1016/S0013-4694(96)95176-0.
Snyder, A., Morais, M., Willis, C., et al.. (2015). Global network influences on local functional connectivity. Nature Neuroscience 18, 736–743. https://doi.org/10.1038/nn.3979