Event-Related Potentials (ERPs)#
Event-related potentials (ERPs) are a particular kind of measure derived from EEG data. EEG is a continuous measure of electrical brain activity. ERPs, on the other hand, are short segments of EEG data that are time-locked to particular events of experimental interest, and typically averaged over many trials of an experiment. Typically we record EEG data continuously throughout an experiment, and then chop the data into epochs (short segments of data) that are time-locked to the events of interest. The events of interest are commonly the onset of stimuli, or the onset of motor responses (e.g., button presses or eye movements). The idea of ERPs is that by time-locking brain activity to particular events, we can see what patterns of brain activity occur systematically in response to those events.
As discussed earlier, EEG is a challenging technique both because the data at any electrode typically reflects activity of many distributed brain areas, and because the data are contaminated by many noise sources. By averaging together data from many trials in which the same stimulus (or stimuli of a particular category or experimental condition) is presented, we can gain insights into what responses occur systematically in response to the stimulus. We assume that brain activity unrelated to the stimulus/task, as well as noise, would not occur systematically in response to the stimuli, and so across multiple trials the irrelevant brain activity and noise should average out, whereas the systematic response to the stimuli should become increasingly evident.
Indeed, the signal-to-noise ratio of ERP data increases roughly with the square root of the number of trials that contribute to it. Depending on the particular ERP effect under investigation, a typical experiment might present anywhere from 30-40, to 100 or even 1000 stimuli from each experimental condition in order to obtain a reliable ERP. The number of stimuli depend on the size of the expected ERP signal (smaller signals require more trials to be detectable), as well as pragmatic constraints (e.g., in studies of sentence processing, it takes several seconds for a person to read or listen to one sentence — whereas if the stimuli are auditory tones that are 100 ms in duration, a lot more stimuli can be presented in a given time period). The figure below shows data from a single individual in an experiment where images of faces were presented. In each panel, the odd-numbered trials are plotted against the even-numbered trials, with increasing numbers of trials included in each average. Since there was nothing systematically different about the odd and even trials, the odd- and even-numbered trial averages should look identical, to the extent that they reflect a consistent sequence of brain responses evoked by the stimuli. The differences that are evident in each panel between odd and even trials — especially when there are few trials in each average — reflect the random noise that contaminates the data on each individual trial. It’s clear that, at least in this particular data set, there are diminishing returns to doubling the number of trials beyond 32 or 64.
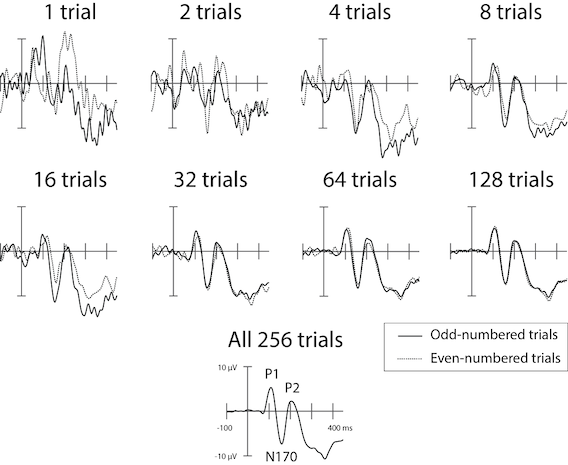
Fig. 12 Effects of averaging increasing numbers of trials in an ERP experiment, for a single human participant. Stimuli were images of human faces. There were a total of 256 trials in the experiment, and the average of these is shown at the bottom, with prominent component peaks (see next section) labelled.#
Thus in a typical ERP experiment, many trials will be presented in two or more experimental conditions, and the results will be analyzed across all trials in each condition. The effects of interest may occur before or after the particular event that the ERPs are time-locked to. If the interest is in the response to stimuli, typically the focus of analysis is on the ERPs occurring after the stimulus onset. If the focus is on a motor response, the focus of analysis may be on brain activity prior to the onset of the response — for example if the interest is in response preparation — or after the response, for example if the interest is in how people interpret their own responses (for example, one might compare brain activity after correct versus incorrect responses).
Analyzing ERP data thus requires segmenting the EEG data into short time periods of data around the events of experimental interest. These segments (often called epochs) can vary from a few hundred milliseconds to several seconds, depending on the timing of the expected effects. Typically, the epochs include a period of time prior to the onset of the event of interest (or after the event, if the interest is in activity prior to the event). This serves as a baseline period to compare the experimentally-related brain activity to. For example, in the figure above, the epoch is 450 ms in duration, plus a 100 ms baseline period.