Time and Frequency Domains#
As a time-varying signal, EEG can be viewed, analyzed, and interpreted in two distinct ways, or domains. The common way of viewing EEG data is in the time domain, with time plotted on the x axis, and potential (voltage) on the y axis, as shown below.
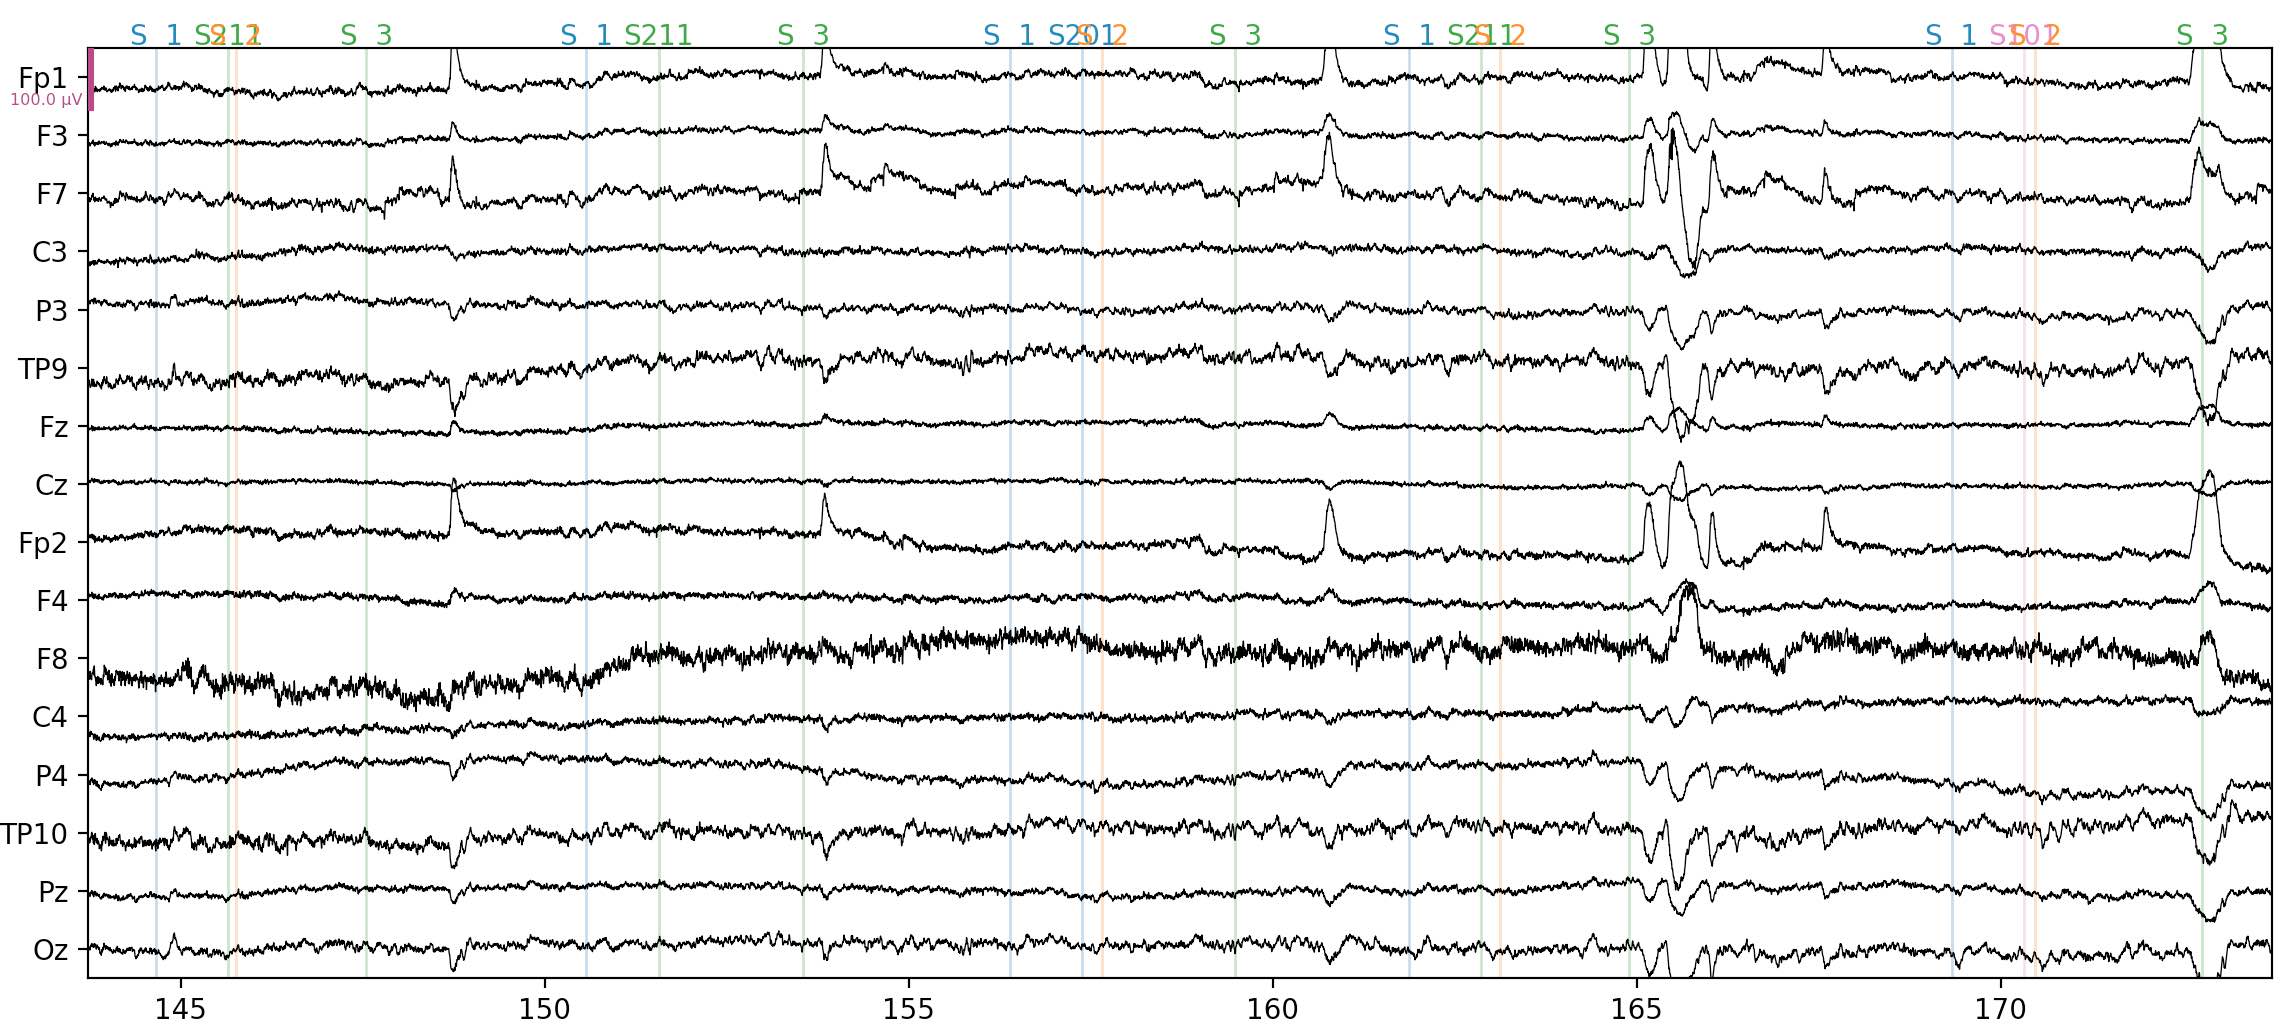
Fig. 8 A 30 s sample of continuous EEG data, visualized in the time domain.#
Alternatively, EEG can be viewed in the frequency domain. This is done by applying a mathematical transformation, typically a fast Fourier transform (FFT). The FFT is based on a principle that any time-varying signal can be created from (or broken down into) a set of sine waves of varying frequencies and amplitudes, added together. Sine waves are regularly oscillating waveforms, such as this:
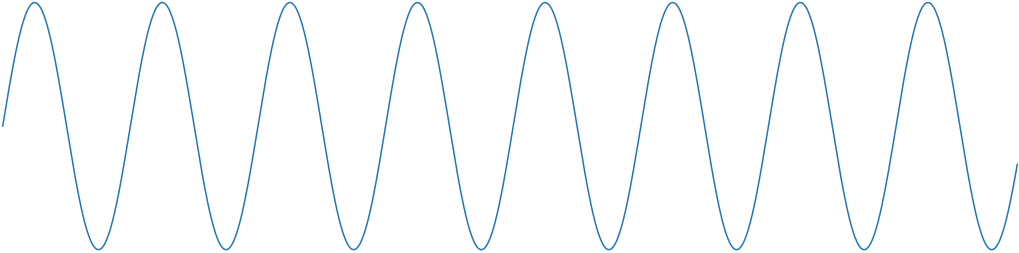
Fig. 9 A sine wave.#
Clearly, an EEG signal such as the one shown in the top figure is much more complicated than a simple sine wave! The amplitude (deflection on the y axis) varies over time, as does the frequency (the spacing between the peaks and troughs over time) But, by combining a large number of sine waves of different frequencies, each with a specific amplitude, we can mathematically describe even a complex EEG waveform. The figure below shows a very simple example, composed of a limited set of sine waves:
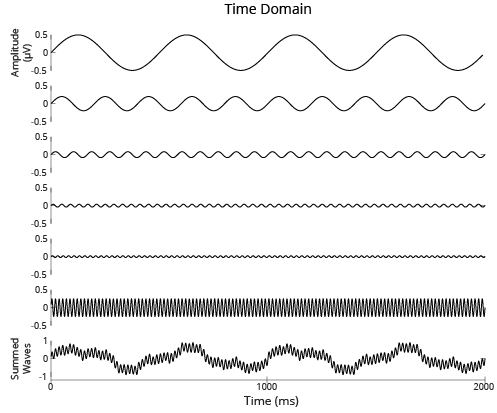
Fig. 10 A Fourier series — a set of sine waves of varying frequencies and amplitudes, along with their sum (bottom panel).#
Applying an FFT to EEG data generates a representation of the data in the frequency domain. The FFT estimates the amplitudes of each of a wide range of sine waves (many more than shown in the figure above), and the frequency domain data represent these amplitudes, with their corresponding frequencies. The results can be plotted in the frequency domain, i.e., with frequency on the x axis, rather than time, and amplitude on the y axis. Note that in the frequency domain, the amplitude of each frequency is generally referred to as power, not amplitude.
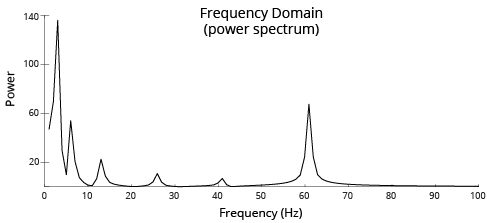
Fig. 11 The summed Fourier series shown in the bottom panel of the previous figure, but plotted in the frequency domain. The peaks correspond to the frequencies of sine waves used in the series. A frequency domain plot like this is often referred to as a power spectrum.#
One important thing to note about the frequency domain representation of the data is that we lose temporal information. The power at each frequency in the figure above is the average power across the entire time frame of the data we provided. We don’t necessarily have to use the entire time range of our data to compute a FFT and generate frequency domain data. Indeed, a common approach to EEG analysis is time-frequency analysis (TFA), in which the power at each frequency is computed separately at a sequence of time points.
However, it should be fairly intuitive that, at a minimum, the time domain data should be long enough for at least one cycle (time from one peak to the next) of a sine wave to occur (in practice, we would want to have at least 2-3 cycles). Thus the duration of the data we have determines the lowest frequency we can estimate, since lower frequencies take more time to complete one cycle. For example, if a sine wave has a frequency of 1 Hz, that means it contains 1 cycle/second. A 60 Hz sine wave, on the other hand, contains 60 cycles/second. Thus we can estimate a 60 Hz sine wave from a much shorter sample of time than we need to estimate a 1 Hz sine wave. On the other hand, for measuring any given frequency, a longer sample of time will necessarily give a more accurate estimate, because there are more samples (cycles) over which to measure the frequency. A useful phrase to remember this relationship between the time and frequency domains is, precision in the time domain is inversely related to precision in the frequency domain.
You may wonder why we care about sine waves and Fourier transforms at all, when working with EEG data. One reason is that the brain appears to generate both periodic (oscillating sine wave) activity, and aperiodic (“one-off” peaks and troughs) signals. The time domain is typically best for viewing and analyzing aperiodic signals, and this is the basis of much cognitive neuroscience research using event-related potentials (ERPs, which are covered in the next sections). However, the frequency domain is better for viewing and analyzing periodic signals. Indeed, the brain appears to use different ranges of frequencies, called frequency bands, to perform different tasks and communicate different signals between brain regions. A table of these is below.
Band |
Frequency Range ( Hz) |
|---|---|
Delta |
< 3 |
Theta |
4–7 |
Alpha |
8–14 |
Mu |
8–12 |
Beta |
15–30 |
Gamma |
> 30 |
In general, activity in each frequency band is somewhat nonspecific. That is to say, an increase in power in a given frequency band may reflect any number of different neurocognitive processes. Knowing the conditions under which the EEG was recorded is thus critical for interpreting these frequency bands, as is the location on the scalp where they are largest. That said, there are some common generalizations. For example, delta waves are primarily seen during sleep, or when people are falling asleep. Alpha waves over occipital electrodes are often generated when people close their eyes (thus blocking visual stimulation), or when they are bored — but they are also associated with several other cognitive processes. Mu waves have a similar frequency range to alpha, but are associated with motor activity (arm or other body movements) and are focal over the motor cortex, as are beta waves.