What is EEG?#
EEG, or electroencephalography, is a technique that records electrical activity from the brain. Typically, it is recorded non-invasively, from electrodes placed on the scalp, although it can also be recorded from electrodes placed directly on the surface of the brain (typically for clinical neurological purposes, such as in epilepsy). EEG typically involves the use of between 1–250 electrodes; even at the upper end of that range, clearly there are far fewer electrodes than the estimated 80 billion or so neurons in the brain. As well, the skull is a poor conductor of electricity. This means that what we record with EEG is inevitably the aggregated activity of large numbers of neurons working together. The image below shows an example of an EEG system.
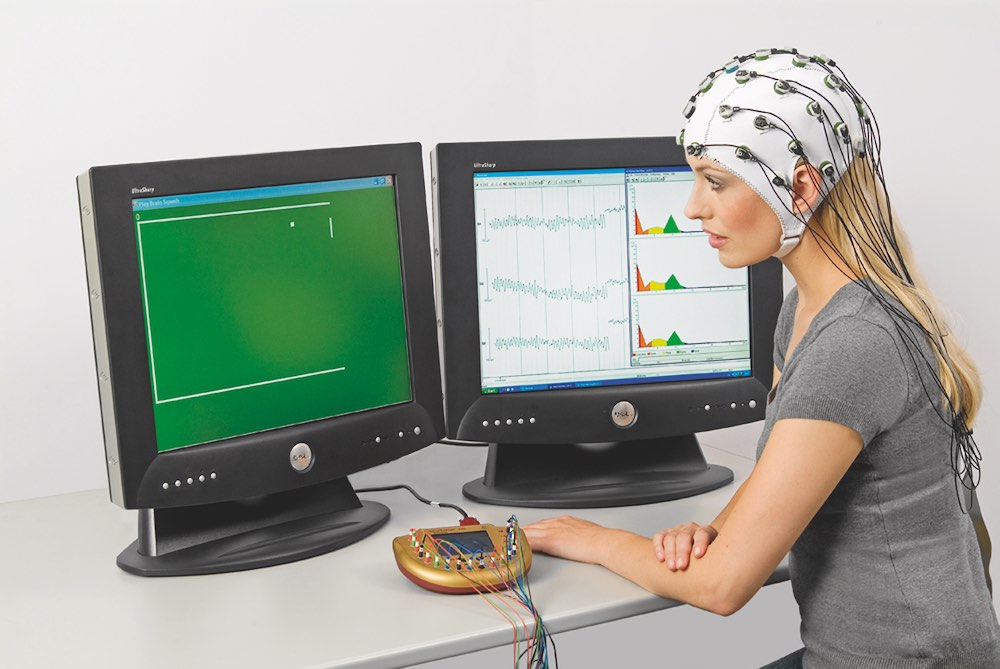
Fig. 3 An EEG system. The model is wearing a cap to which multiple electrodes are attached. The electrodes connect to the gold-colored amplifier sitting on the table. The right screen shows the ongoing EEG recorded from the scalp, while the left screen shows the experimental stimuli that the model is attending to. Image courtesy Brain Vision LLC.#
The image below shows a 10 s sample of continuous, raw EEG data recorded from a cognitive neuroscience experiment. Each horizontal trace is the data from one electrode (channel). The colored vertical lines, which have labels at the top, represent specific events of experimental interest (e.g., stimulus onsets or participant responses). The large deflections, particularly evident in channels Fp1, F7, and Fp2, are artifacts (sources of noise) caused by eye blinks. EEG recordings reflect a combination of brain activity and non-neural noise. For example, eye movements, blinks and muscle contractions all create electrical potentials that can be picked up by EEG electrodes on the scalp. As we’ll see in the following sections, removing artifacts is a key part of the EEG data processing pipeline.
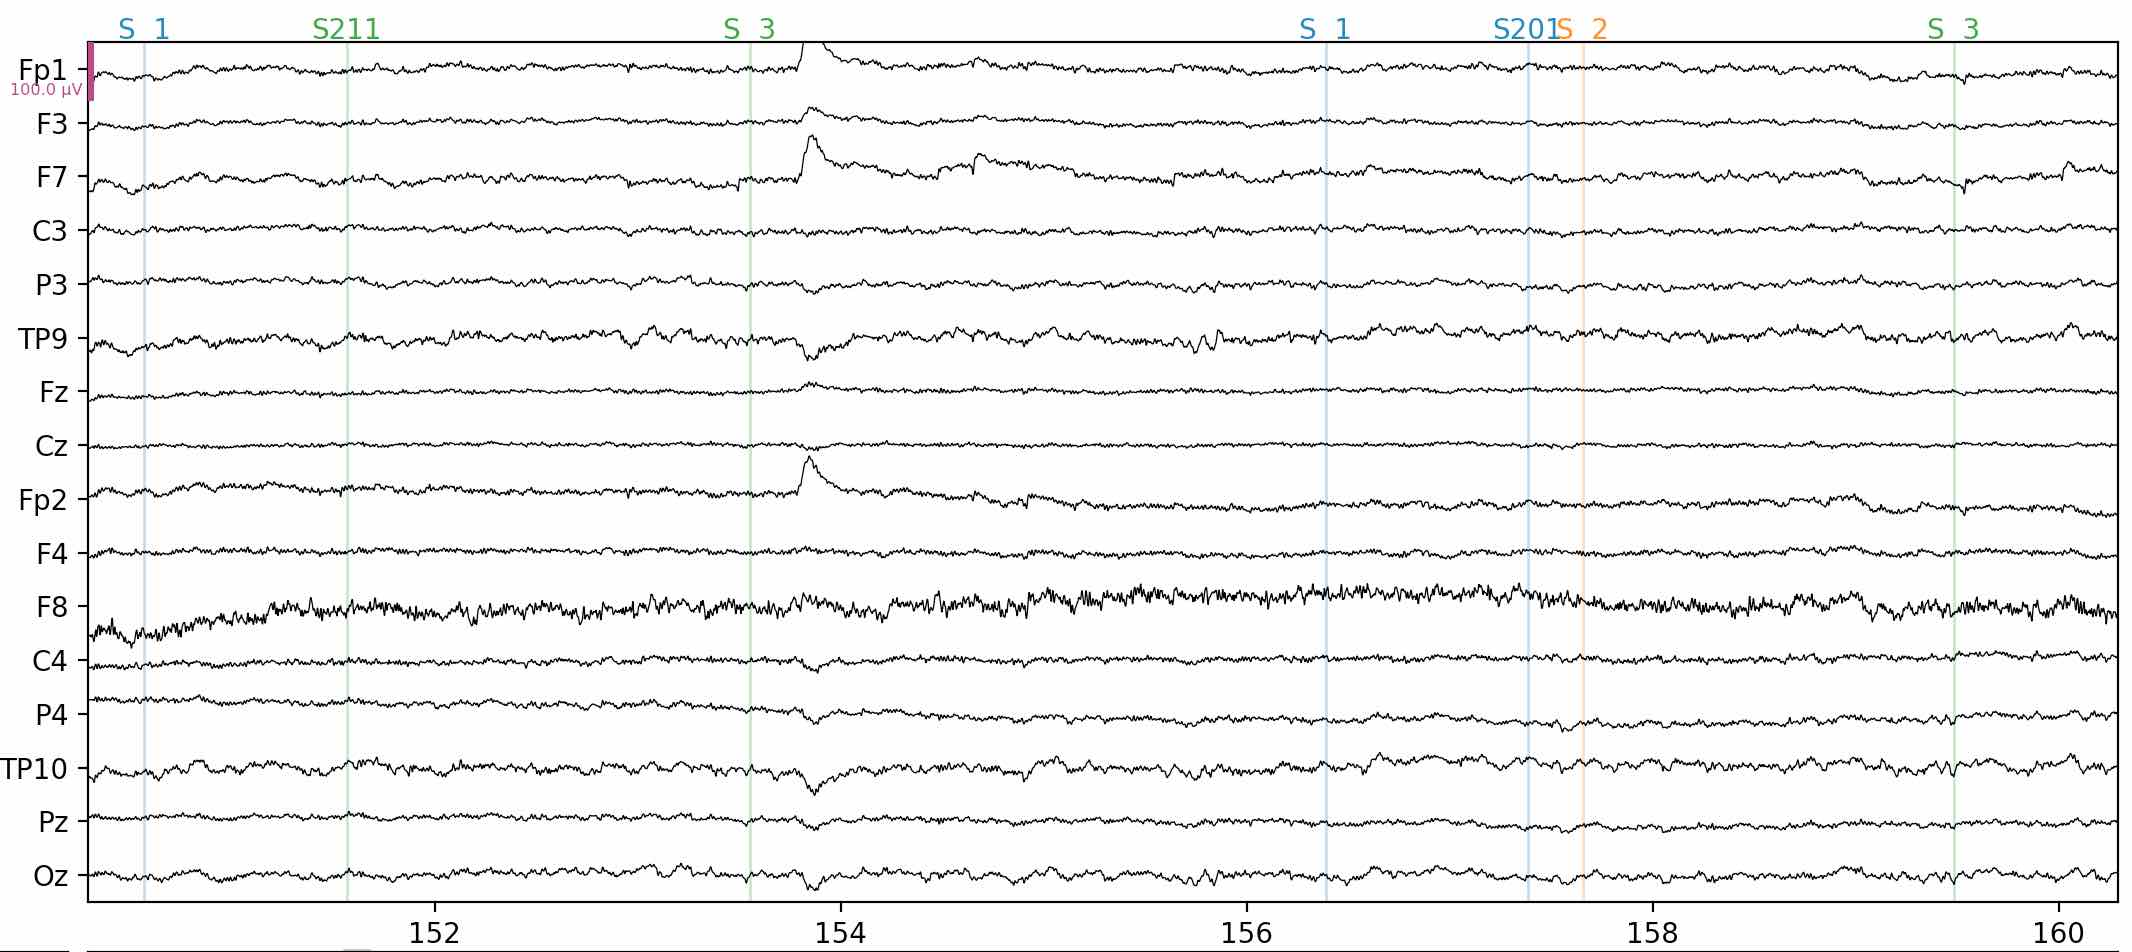
Fig. 4 Sample EEG data from 16 electrodes, over a period of 10 s.#
EEG Can be Confusing#
EEG can be a bit challenging for people to get their heads around at first (pun intended), because there are some non-intuitive features of the data. One of the most important considerations is that EEG is not a good technique for localizing where activity occurs in the brain. Because the electrodes are placed on the outside of the scalp, and because the brain and its encasing cerebrospinal fluid are very good electrical conductors, a signal that originates in one location in the brain will propagate throughout the brain. In other words, in principle any signal inside the brain should be detectable by an electrode placed anywhere on the outside of the brain. Add to this consideration of the fact that, inevitably, many brain areas will be active simultaneously (or in rapid but overlapping succession), and it becomes clear that any signal recorded outside the scalp is a mixture of the signals from multiple active parts of the brain — at least, those that generate a strong and coherent enough signal to pass through the poorly-conducting skull.
For this reason, source localization with EEG is described as an inverse problem (finding the sources on the inside, given the data from the outside, of the head). Mathematically, the inverse problem is ill-posed, meaning that there are essentially an infinite number of possible solutions — i.e., different combinations of locations and strengths of sources in the brain that would generate identical patterns of electrical activity at the scalp. This is not to say source localization is always impossible. Indeed, it can work quite well, especially for signals like early sensory responses, where the location of the neural generators of the signal are focal and well-known (e.g., primary visual or auditory cortex). However, there are better techniques for localizing activity in the brain. The real value of EEG in cognitive neuroscience lies elsewhere.
Another thing that many people find confusing about EEG at first, is the fact that the electrical potentials that are measured can be either positive or negative. Many people intuitively think that positive is brain “activation” and negative is “deactivation”, but this is not true. EEG is typically measured in microVolts (μV, or thousandths of a Volt). The voltage is the difference in electrical potential between the electrode and a reference electrode which is located somewhere else on the head. The voltage (electrical potential) recorded at each electrode may be positive or negative depending on what the relative potential is at the reference electrode. For this reason, either a negative or positive electrical potential reflects a signal of interest; whether it is positive or negative, it still reflects brain activation. We will discuss reference electrodes later in this chapter.
One helpful way to understand why positive and negative potentials both reflect neural activity, is by understanding how these signals are generated in the brain. If we consider a small patch of the cerebral cortex (say, 1 cm square), it contains thousands of neurons. Many of these are pyramidal neurons, which play a key role in cognition. Pyramidal neurons are largely aligned perpendicular to the scalp, with all of the cell bodies in a deep layer of the cortex, and their axons extending outward from the cell bodies towards the cortex. Input signals to these cells arrive at or near the body of the cell, and the output signals are delivered down the axons where they connect at synapses to other cells. This is shown in the figure below, taken from the exquisite drawings of the pioneering neuroatanomist Ramon y Cajal.
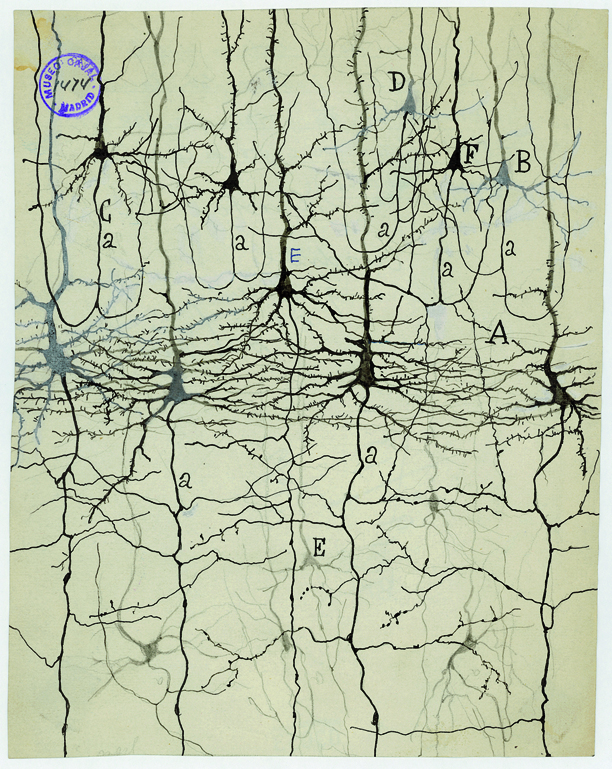
Fig. 5 Pyramidal neurons in the cerebral cortex. The cell bodies are the large black triangle shapes, with their axons extending upward in the image, towards the outer surface of the cerebral cortex. Drawing by Ramon y Cajal.#
At rest, the inside of a neuron’s cell body has a negative potential. This means that, relative to the ends of the axons, the cell body is more negative, and the ends of the axons are more positive. Thus if we inserted electrodes into the brain, and placed one near the cell body and one near the end of the axon, we would measure a positive potential at the end of the axon, and a negative potential at the cell body. When inputs arrive at the cell body of a neuron, they tend to cause it to depolarize, meaning that the cell body will become more negative. When we do EEG, we place the electrodes outside of the head, but since the head is a good conductor of electricity, we get essentially the same effect: an electrode directly over the patch of cortex under consideration would reflect a positive potential, relative to an electrode placed on the opposite side of the head, which would have a relatively negative potential. Another way of thinking about this is that any source of electrical activity in the brain can be modeled as an electrical dipole, as shown in the figure below. A dipole has positive and negative poles, and the strength of activation of the brain area is the difference in electrical potential between the poles. Electrodes placed above the dipole in the figure would measure a positive potential (the arrowhead represents the positive pole), and electrodes placed below the dipole would measure a negative potential.

Fig. 6 A model of a single electrical dipole located inside a head. The dipole is indicated by the arrow, whose point represents the positive pole of the dipole. The read shading indicates where positive electrical signals would propagate from this dipole, through the head and outward to the scalp. Electrodes placed on scalp areas over the blue shading would record positive potential. The decreasing color represents how the strength of the positive signal would drop with distance. It can be see that one area near the top of the head would show a stronger positive signal (darker color) than the rest of the “positive” area of the scalp. Likewise, the blue shading represents the propagation of the signal from the negative pole of the dipole. Electrodes placed on scalp areas over the blue shading would record negative potential. Image adapted from Geek3, CC BY-SA 4.0, via Wikimedia Commons.#
The figure above also illustrates how positive and negative potentials generated by a dipole in the brain would “look” when recorded by EEG electrodes on the scalp. The strength of the recorded signal depends on the distance between the dipole and the electrode, and the orientation of the dipole relative to the electrode. The figure below shows an example of how the recorded potentials would look for a single dipole located at a particular point in the brain, but with different orientations.
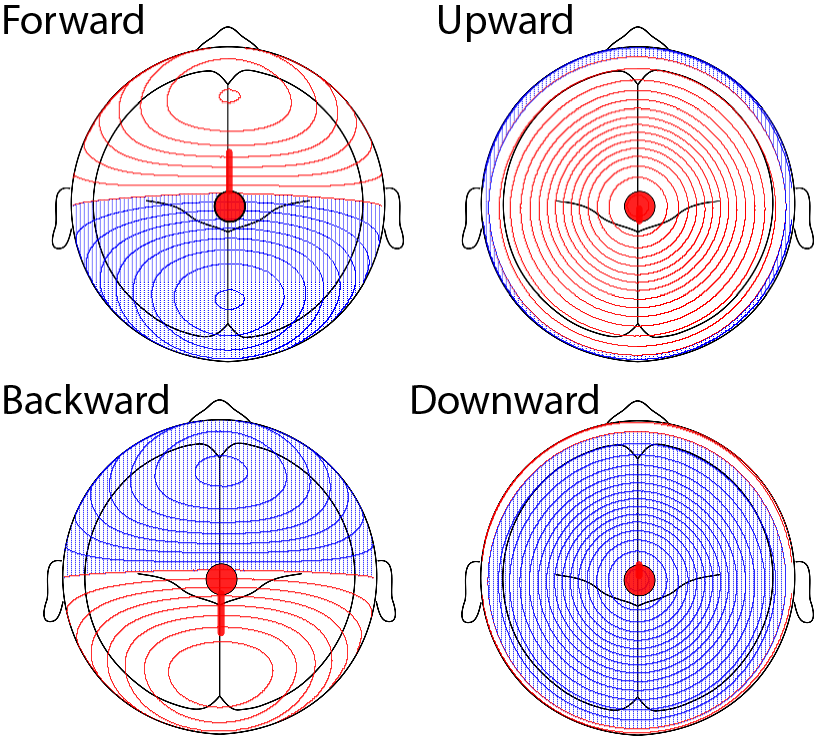
Fig. 7 Models of the EEG scalp potentials that would be recorded if a single electrical dipole (shown as a red circle, with a line extending in the direction of the positive pole) were active inside the head. Red lines show positive potentials and blue lines show negative potentials. Each of the four panels shows the distribution of potentials over the scalp for a different orientation of the dipole, with the location of the dipole held constant. Images generated using BESA Simulator software.#
Each panel shows the same dipole location, but with its positive pole oriented in a different direction. From this illustration, it is clear that each source in the brain generates both positive and negative potentials, but how they are distributed on the scalp depends on the orientation of the dipole. Of course, this is an extremely simple example; in practice we can imagine that the cortex is composed of a large number of dipoles, each with a specific orientation (depending on the folding pattern of the cortex), and strength (depending on the level of activation in that region).
What EEG is Good For#
The best and most widely-employed uses of EEG focus on the signals as they are recorded on the scalp, without focusing on where in the brain they come from. Decades of research have provided a substantial evidence base relating particular EEG signals to particular cognitive functions or tasks, and so a primary use of EEG is to identify if, and/or how strongly, one or more of these signals occurs during a task (and/or how the signals differ between task conditions). We’ll elaborate on these points in the sections that follow.
A second, and related, value of EEG is in its temporal resolution. EEG can measure brain activity on the order of milliseconds, or even less — and the signals that we measure can show very small, but reliable timing differences on the order of tens of milliseconds. This means that EEG can reveal the sequence of cognitive events as they unfold in real time, as well as differences in the speed at which different processes are engaged.
One important distinction between EEG and other types of data we have worked with so far is that EEG is recorded as a continuous, time-varying signal. This means the data are a time series. Although some of the single unit data we have seen before was stored in a time series (i.e., regularly-spaced data points over time), the signal was not continuous but rather discrete. That is, in single unit data, each time point could only be 0 (no spike) or 1 (spike). In contrast, EEG is recorded as electrical potential (voltage), which varies continuously (e.g., voltage could be 0, or 0.0001, or 10.352, or -82.43, etc.). EEG data also typically include a spatial dimension, because the electrodes are placed across the scalp and different electrodes will detect different signals depending on their location.
Now that you understand a bit about what EEG data reflects, let’s dig into the details of how the data is stored, and how we can process and analyze it.